7.3 Tasks: Alertrules and alerts
Note
For doing the alerting lab it’s useful to have a “real” application so that alerts can be provoked. You will use the demo app installed in your monitoring-demo namespace for this purpose.
The example app exposes metrics which are already scraped from lab one.
{job="example-web-python"}
The Prometheus Operator allows you to configure Alerting Rules (PrometheusRules). This enables Kubernetes users to configure and maintain alerting rules for their projects. Furthermore it is possible to treat Alerting Rules like any other Kubernetes resource and lets you manage them in Helm or Kustomize. A PrometheusRule has the following form:
apiVersion: monitoring.coreos.com/v1
kind: PrometheusRule
metadata:
  name: <resource-name>
spec:
  <rule definition>
See the Alertmanager documentation
for <rule definition>
Task 7.3.1: Add an alerting rule for crashlooping pods
- Define an alerting rule which sends an alert when a pod in your namespace is crashlooping at least once in the last 5 minutes
- New alarms should be in
pendingstate for 15 minutes before they transition to firing - Add a label
severitywith the valueinfo - Add an annotation
summarywith information about which pods and job is down
To add an Alerting rule, create a PrometheusRule resource user-demo/training_testrules.yaml in the monitoring folder of your repository.
apiVersion: monitoring.coreos.com/v1
kind: PrometheusRule
metadata:
  name: testrules
spec:
  groups:
    - name: pod-rules
      rules:
        - alert: kubePodCrashLooping
          expr: rate(kube_pod_container_status_restarts_total{job="kube-state-metrics",namespace="<user>-monitoring"}[5m]) * 60 * 5 > 0
          for: 15m
          annotations:
            message: Pod {{ $labels.namespace }}/{{ $labels.pod }} ({{ $labels.container }}) is restarting {{ printf "%.2f" $value }} times / 5 minutes.
          labels:
            severity: info
You can build/verify your Query in your Thanos Querier UI . As soon, as you apply the PrometheusRule resource, you should be able to see the alert in your Thanos Ruler implementation.
Task 7.3.2: Add a an alert for absent targets
Task description:
- Define an alerting rule which sends an alert when a target is down. Remember the
upmetric? - New alarms should be in
pendingstate for 2 minutes before they transition to firing - Add a label
userwith the value<user> - Add an annotation
summarywith information about which instance and job is down
Hints
Either create a separate PrometheuRule resource as you did before, or add the group definition below to your existing PrometheusRule resource.
groups:
  - name: job-rules
    rules:
      - alert: target-down
        expr: up == 0
        for: 2m
        labels:
          user: <user>
        annotations:
          summary: Instance {{ $labels.instance }} of job {{ $labels.job }} is down
The value in field for is the wait time until the active alert gets in state FIRING. Before that, the alert is PENDING and not yet sent to Alertmanager.
The alert is instrumented with the labels from the metric (e.g. joband instance). Additional labels can be defined in the rule. Labels can be used in Alertmanager for the routing.
With annotations, additional human-readable information can be attached to the alert.
- In the Prometheus web UI there is an Alerts menu item which shows you information about the alerts.
Task 7.3.3: Verify the target down alert
In this task you’re going to explore what happens, when a rule fires and sends an alert.
First we add the following rule to our rules, commit and push the changes to git:
groups:
  - name: test-rules
    rules:
      - alert: memory-usage-to-high
        expr: container_memory_usage_bytes{namespace="user6", pod=~"example-spring-boot.*", image!="", container!=""} / 1024 / 1004 > 256
        for: 1m
        labels:
          user: <user>
        annotations:
          summary: Java App {{ $labels.namespace }}/{{ $labels.pod }} ({{ $labels.container }}) uses more than 256 Mi Memory
We know that our Spring boot example from the Lab 6 uses more than that. If not, we should decrease the threshold.
- The Thanos Ruler UI Alerts [menu item](Thanos Ruler /alerts) shows you information about inactive and active alerts.
- As soon as an alert is in state
FIRINGthe alert is sent to Alertmanager. You should see the alert in its web UI . This might take some time.
Task 7.3.4: Silencing alerts
Sometimes the huge amount of alerts can be overwhelming, or you’re currently working on fixing an issue, which triggers an alert. Or you’re simply testing something that fires alerts.
In such cases alert silencing can be very helpful.
Let’s now silence our test alert.
Open the Alertmanger web UI and search for the test alert.
Note
The alert might have been resolved already, use the following command to re-trigger it again:
kubectl --namespace $USER-monitoring exec -it statefulsets/alertmanager-$USER-alertmanager -c alertmanager -- sh
amtool alert add --alertmanager.url=http://localhost:9093 alertname=Up node=bar namespace=<user>-monitoring
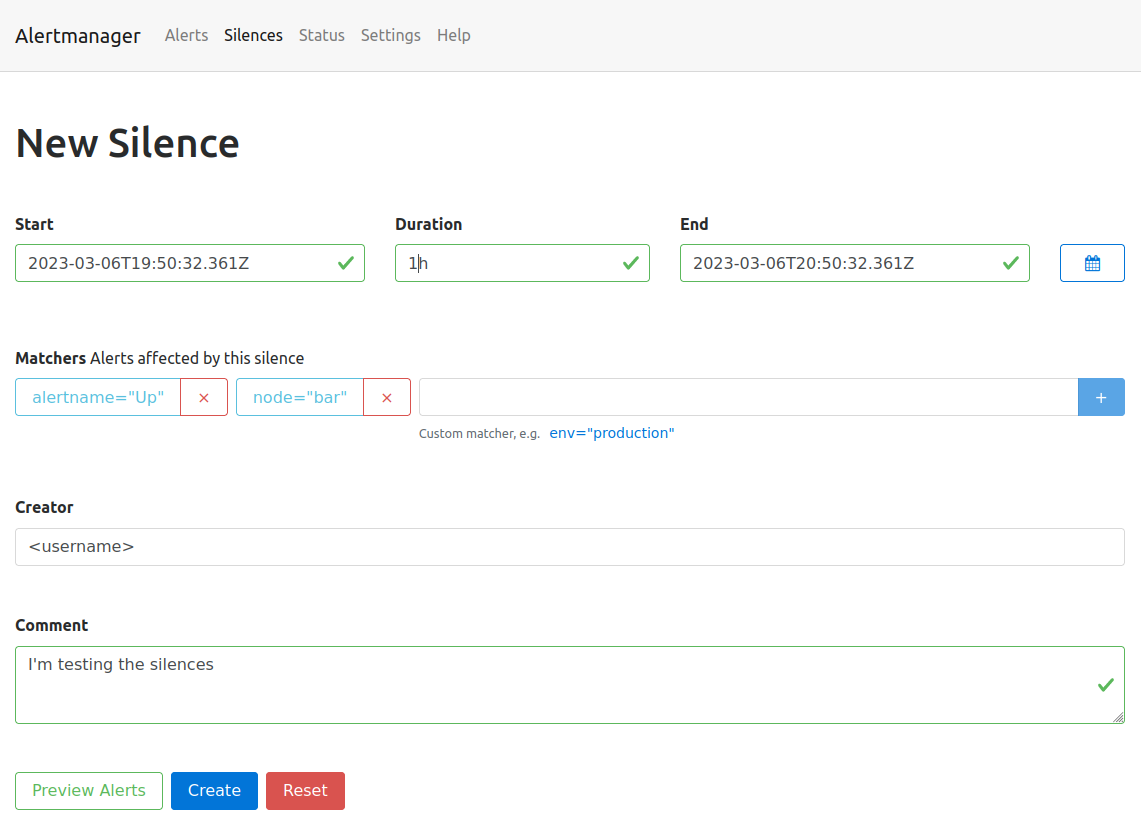
You can either silence the specific alert by simply clicking on the Silcence button next to the alert, or create a new silence by clicking the New Silence button in the top menu on the right.
Either way, you’ll end up on the same form. The button next to the alert will conveniently fill out the matchers, so that the alert will be affected by the new silence.
- Click the
Silencebutton next to the test alert. - Make sure the matchers contains the two labels (
alertname="Up",node="bar") of the test alert. - Set the duration to 1h
- Add your username to the creator form field.
- Fill out the description with the reason you’re creating a silence.
You can then use the Preview Alerts button to check your matchers and create the alert by clicking create.
All alerts, which match the defined labels of the matcher will be silenced for the defined time slot.
Go back to the Alerts page, the silenced alert disappeared and will only be visible when checking the silenced alerts checkbox.
The top menu entry silence will show you a list of the created silences. Silences can also be created programmatically using the API or the amtool (amtool silence --help).
The following command is exactly the same you just did via the Web UI:
kubectl --namespace $USER-monitoring exec -it statefulsets/alertmanager-$USER-alertmanager -c alertmanager -- sh
amtool silence add alertname=Up node=bar --author="<username>" --comment="I'm testing the silences" --alertmanager.url=http://localhost:9093